Table Of Contents
Topography vs bathymetry is a distinction I run into often when clients ask me to “map the land” — only for the project site to include everything from hilltops to water basins. The two terms describe similar concepts but in very different environments. Topography deals with terrain above water: hills, slopes, valleys — everything you see on a contour map. Bathymetry does the same thing, but underwater: measuring depth, contours, and features beneath lakes, rivers, basins or coastlines.
As a drone pilot with over a decade in the field, I’ve worked both sides of this line. On the topographic side, I typically deploy RTK-enabled drones with LiDAR or photogrammetry to generate high-resolution elevation models. On the bathymetric side, I’ve shifted entirely to UAS-mounted bathymetric LiDAR — especially green laser systems that penetrate shallow water and generate accurate point clouds where boat-based sonar can’t safely operate.
Organizations like the USGS rely on topographic data for infrastructure planning and environmental modeling. Meanwhile, the NOAA Office of Coast Survey has been actively testing drone-based bathymetric workflows to increase speed, safety, and efficiency in shallow zones.
If you’re working on flood modeling, shoreline erosion, or any mixed-terrain project — understanding where topography ends and bathymetry begins is more than academic. It directly impacts the sensors you use, the flight planning you’ll do, and the data you deliver.
What Is Topography?
In drone surveying, topography is the backbone of most land-based projects I take on. Whether I’m mapping a construction site, grading a slope for earthworks, or flying a floodplain for FEMA compliance, topographic data gives us the lay of the land — literally. It defines the elevation, contours, and surface features of terrain above sea level.
Topography is typically captured using LiDAR, photogrammetry, or a combination of both — depending on what the job calls for. In my own work, I often run RTK-enabled UAVs to get centimeter-grade accuracy, then process the point clouds to build out digital elevation models (DEMs) or contour maps that clients can actually use. Topography primarily uses remote sensing technologies and field surveys for data collection, ensuring accurate and detailed representations of the terrain.
Unlike older survey methods that rely on ground crews with total stations, drones allow us to capture large areas faster and with far more detail. That’s especially useful when we’re working in rough terrain, active job sites, or places that are just unsafe to walk.
According to the USGS National Map, topographic data is essential for planning infrastructure, monitoring environmental change, and managing natural hazards — and drone tech is now the preferred method for collecting it efficiently and accurately.
What Is Bathymetry? (Drone‑Based)
Bathymetry is the underwater equivalent of topography — mapping the depth, contours, and shape of surfaces beneath water. In my work, this typically applies to shallow environments like basins, reservoirs, rivers, marinas, and near‑shore coastal zones where boats are difficult, dangerous, or too slow to deploy. Historically, bathymetry methods involved depth sounding with a weighted rope, a far cry from the advanced technologies we use today.
As drones have evolved, so has bathymetric surveying. Instead of relying on heavy boats and single‑beam sonar, I now use UAS‑mounted bathymetric LiDAR systems, especially green‑wavelength lasers that penetrate water and return accurate seafloor and riverbed elevations. This allows me to map areas that used to require crews physically entering the water — a major improvement in safety and efficiency.
How Drone Bathymetry Works
Bathymetric LiDAR projects a green laser into the water and measures the return signals from both:
- The water surface
- The bottom beneath the water
By calculating that distance difference — combined with RTK corrections to tighten accuracy — we generate detailed underwater elevation models that integrate perfectly with our land‑based datasets.
That’s the real advantage: a single drone flight can map the land-to-water transition seamlessly.
Use Cases Where Drone Bathymetry Excels
The biggest demand I’m seeing right now includes:
- Flood modeling and stormwater management
- Sedimentation studies in lakes and channels
- Shoreline erosion monitoring
- Environmental assessment before dredging
- Marina and harbor maintenance planning
I’ve personally replaced multi‑day boat surveys with one morning flight — and delivered higher‑resolution data.
External Validation
Organizations like the NOAA Office of Coast Survey are actively testing UAV‑based hydrographic mapping because drones can gather shallow‑water data faster and with less risk to survey crews.
Key Differences Between Topography and Bathymetry
While topography and bathymetry both measure the physical surface of the Earth, the way we capture, process, and apply that data can be drastically different in real-world projects. Over the last decade of flying drone surveys, I’ve found these differences are more than just environmental — they affect everything from planning to post-processing.
Survey Conditions and Environmental Challenges
When I’m flying a topographic job, I’m usually working with open land, consistent reflectivity, and solid GNSS signal. But bathymetric surveys introduce a whole new set of complications — water clarity, sun angle, wind chop, and even algae can interfere with laser penetration. Drone-based bathymetry is powerful, but only when environmental conditions are right.
Data Processing Workflow
With topographic LiDAR or photogrammetry, I can usually go from field to client-ready surface model within a couple of days. Bathymetric data adds extra steps: surface correction, water column filtering, and often manual cleanup to remove false returns from vegetation or turbidity. The end result is worth it, but bathymetry always takes more effort to process accurately.
Sensor Payloads and Integration
Most of my topographic missions are flown with standard RTK drones carrying LiDAR or high-res cameras. For bathymetry, I need specialized gear — usually green-wavelength LiDAR like the RIEGL VQ-840-G or similar, which can get returns from the waterbed. These systems are heavier, more expensive, and require tighter flight planning to stay within legal altitudes and line-of-sight.
Output Data and Client Expectations
Topography often delivers contours, DEMs, and cut/fill reports. Bathymetry tends to feed into hydrologic models, dredging volume estimates, or shoreline restoration plans. Clients need different kinds of deliverables — and I always make that clear up front to avoid scope confusion.
Bathymetric Data
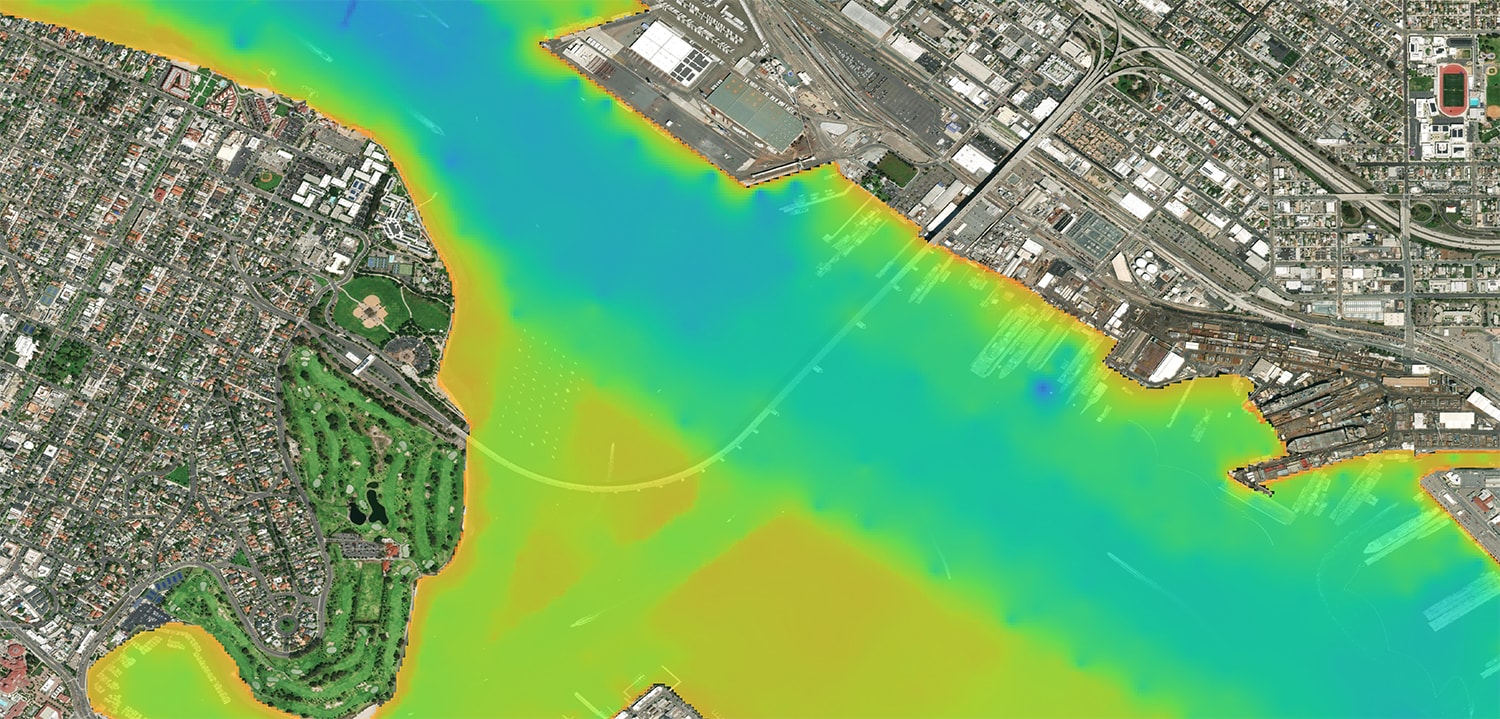
Bathymetric data is what we use to represent the shape and depth of underwater terrain — essentially, the seafloor version of a topographic map. But unlike land elevation surveys, capturing this data with drones requires more than just RTK and LiDAR — it depends heavily on environmental conditions, laser wavelength, and flight strategy.
In my experience, bathymetric data collection using drones is most effective in shallow coastal areas, lakes, and riverbeds, where traditional boat-mounted sonar can’t operate efficiently or safely. I use airborne laser bathymetry, specifically green-wavelength LiDAR systems, to penetrate the water column and return depth measurements of the underwater landscape. This lets me generate high-resolution bathymetric maps that can be stitched seamlessly into topographic models for complete surface-to-seafloor deliverables.
What Makes Bathymetric Data Unique
Compared to topographic data, bathymetric returns tend to be lower in point density and accuracy — not because of the drone, but because lidar data behaves differently in water. Factors like water depth, clarity, turbidity, and even the ocean surface ripple affect the returns. That’s why proper planning around flight height, time of day, and water conditions is critical.
The post-processing side is also more complex. I typically need to apply corrections for refraction, remove ghost points from water surface reflections, and isolate actual underwater features from vegetation or noise. But the result? You get high resolution models of submerged terrain that can support flood modeling, infrastructure design, and underwater hazard mapping.
The more accurate your bathymetric data, the more value it delivers — especially when tied into broader coastal erosion monitoring or habitat protection projects.
Bathymetric Surveys
When clients ask for a “drone survey,” they’re usually thinking about dry land. But bathymetric surveys are an entirely different challenge — and one that’s becoming more accessible thanks to drone-based systems. These surveys focus on mapping underwater elevation, identifying submerged features, and capturing data that can’t be seen from the surface.
In my own fieldwork, I rely on airborne laser bathymetry to collect this kind of data, especially for coastal areas, ponds, rivers, and small harbors. These systems use green-wavelength LiDAR that can measure both the ocean surface and the ocean floor — calculating the difference between the two to generate accurate depth measurements. This technique is far more efficient (and safer) than using boats or wading crews in shallow or murky water.
Planning a Successful Bathymetric Survey
Executing a reliable bathymetric survey requires a completely different mindset than a typical land mapping job. Here’s what I consider on every flight:
- Water Clarity – Poor visibility reduces return strength.
- Sun Angle – Midday flights cut surface reflection.
- Altitude Control – Staying low (around 150 ft AGL) helps maximize accuracy.
- Flight Speed – Slower speeds increase density and detail.
- Overlap – High forward and side overlap is critical, especially near banks or transitions.
I also monitor for underwater hazards like pilings, rocks, or debris that may impact sensor returns — or even flight safety.
Applications of Drone-Based Bathymetric Surveys
Over the last few years, I’ve used drone bathymetric surveys for a variety of clients, including:
- Marina operators managing siltation and dredging volumes
- Municipal stormwater teams modeling flow in retention ponds
- Environmental consultants tracking coastal erosion
- Construction firms verifying pre-dredge ocean depths
The best part? These jobs used to take multiple days with boats and sonar. Now, I can collect usable data in a single morning flight with far less overhead.
Airborne Laser Bathymetry
Airborne laser bathymetry (ALB) is a game-changer in the world of drone surveying. Instead of relying on boat-based sonar or pole-mounted depth rods, we can now collect bathymetric data from the air — safely, quickly, and with surprising accuracy.
The key technology behind ALB is a green-wavelength LiDAR system. Unlike traditional topographic LiDAR, which operates in the near-infrared range and reflects off solid surfaces, green lasers can penetrate clear or moderately turbid water to measure water depth and the position of the ocean floor. The result? You get a clean return from both the ocean surface and the bottom, which gives you vertical precision in environments that were once off-limits to drones. Modern bathymetry also relies on sonar technology, including single-beam and multibeam echosounders, to complement laser-based methods in deeper or more turbid waters.
How I Use ALB in My Workflow
In my field operations, ALB is now my go-to for any project that involves a transition from land to water — especially underwater landscapes like retention basins, shallow rivers, and estuaries. I typically fly these missions at low altitude (under 200 ft AGL), with reduced speed and heavy forward/side overlap to ensure proper point cloud density.
Paired with an RTK-enabled flight controller and careful post-processing, I can generate bathymetric maps that integrate seamlessly with topographic maps collected in the same flight. This fusion is particularly useful for marine topography modeling and underwater feature analysis — especially in areas impacted by coastal erosion or sediment buildup.
Limitations and Environmental Considerations
Not every water body is a good candidate for ALB. Water clarity, bottom reflectivity, surface chop, and underwater hazards can all affect data quality. I’ve found that early mornings with calm weather and clear skies deliver the best results. Still, even with ideal conditions, bathymetric LiDAR generally won’t go deeper than 10–15 meters — which is more than enough for most coastal areas, ponds, or shallow inlets.Topographic Maps
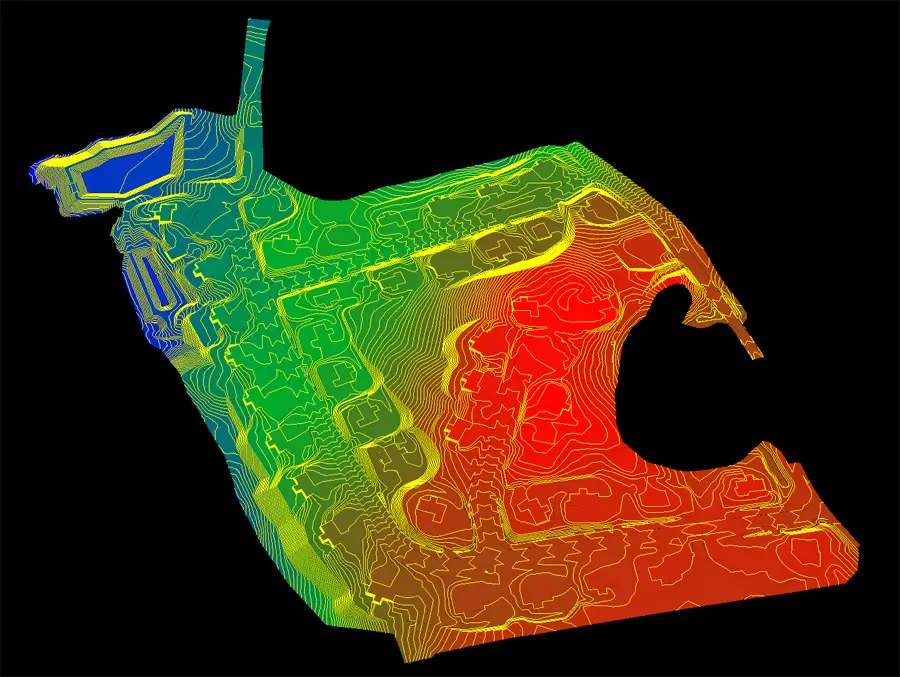
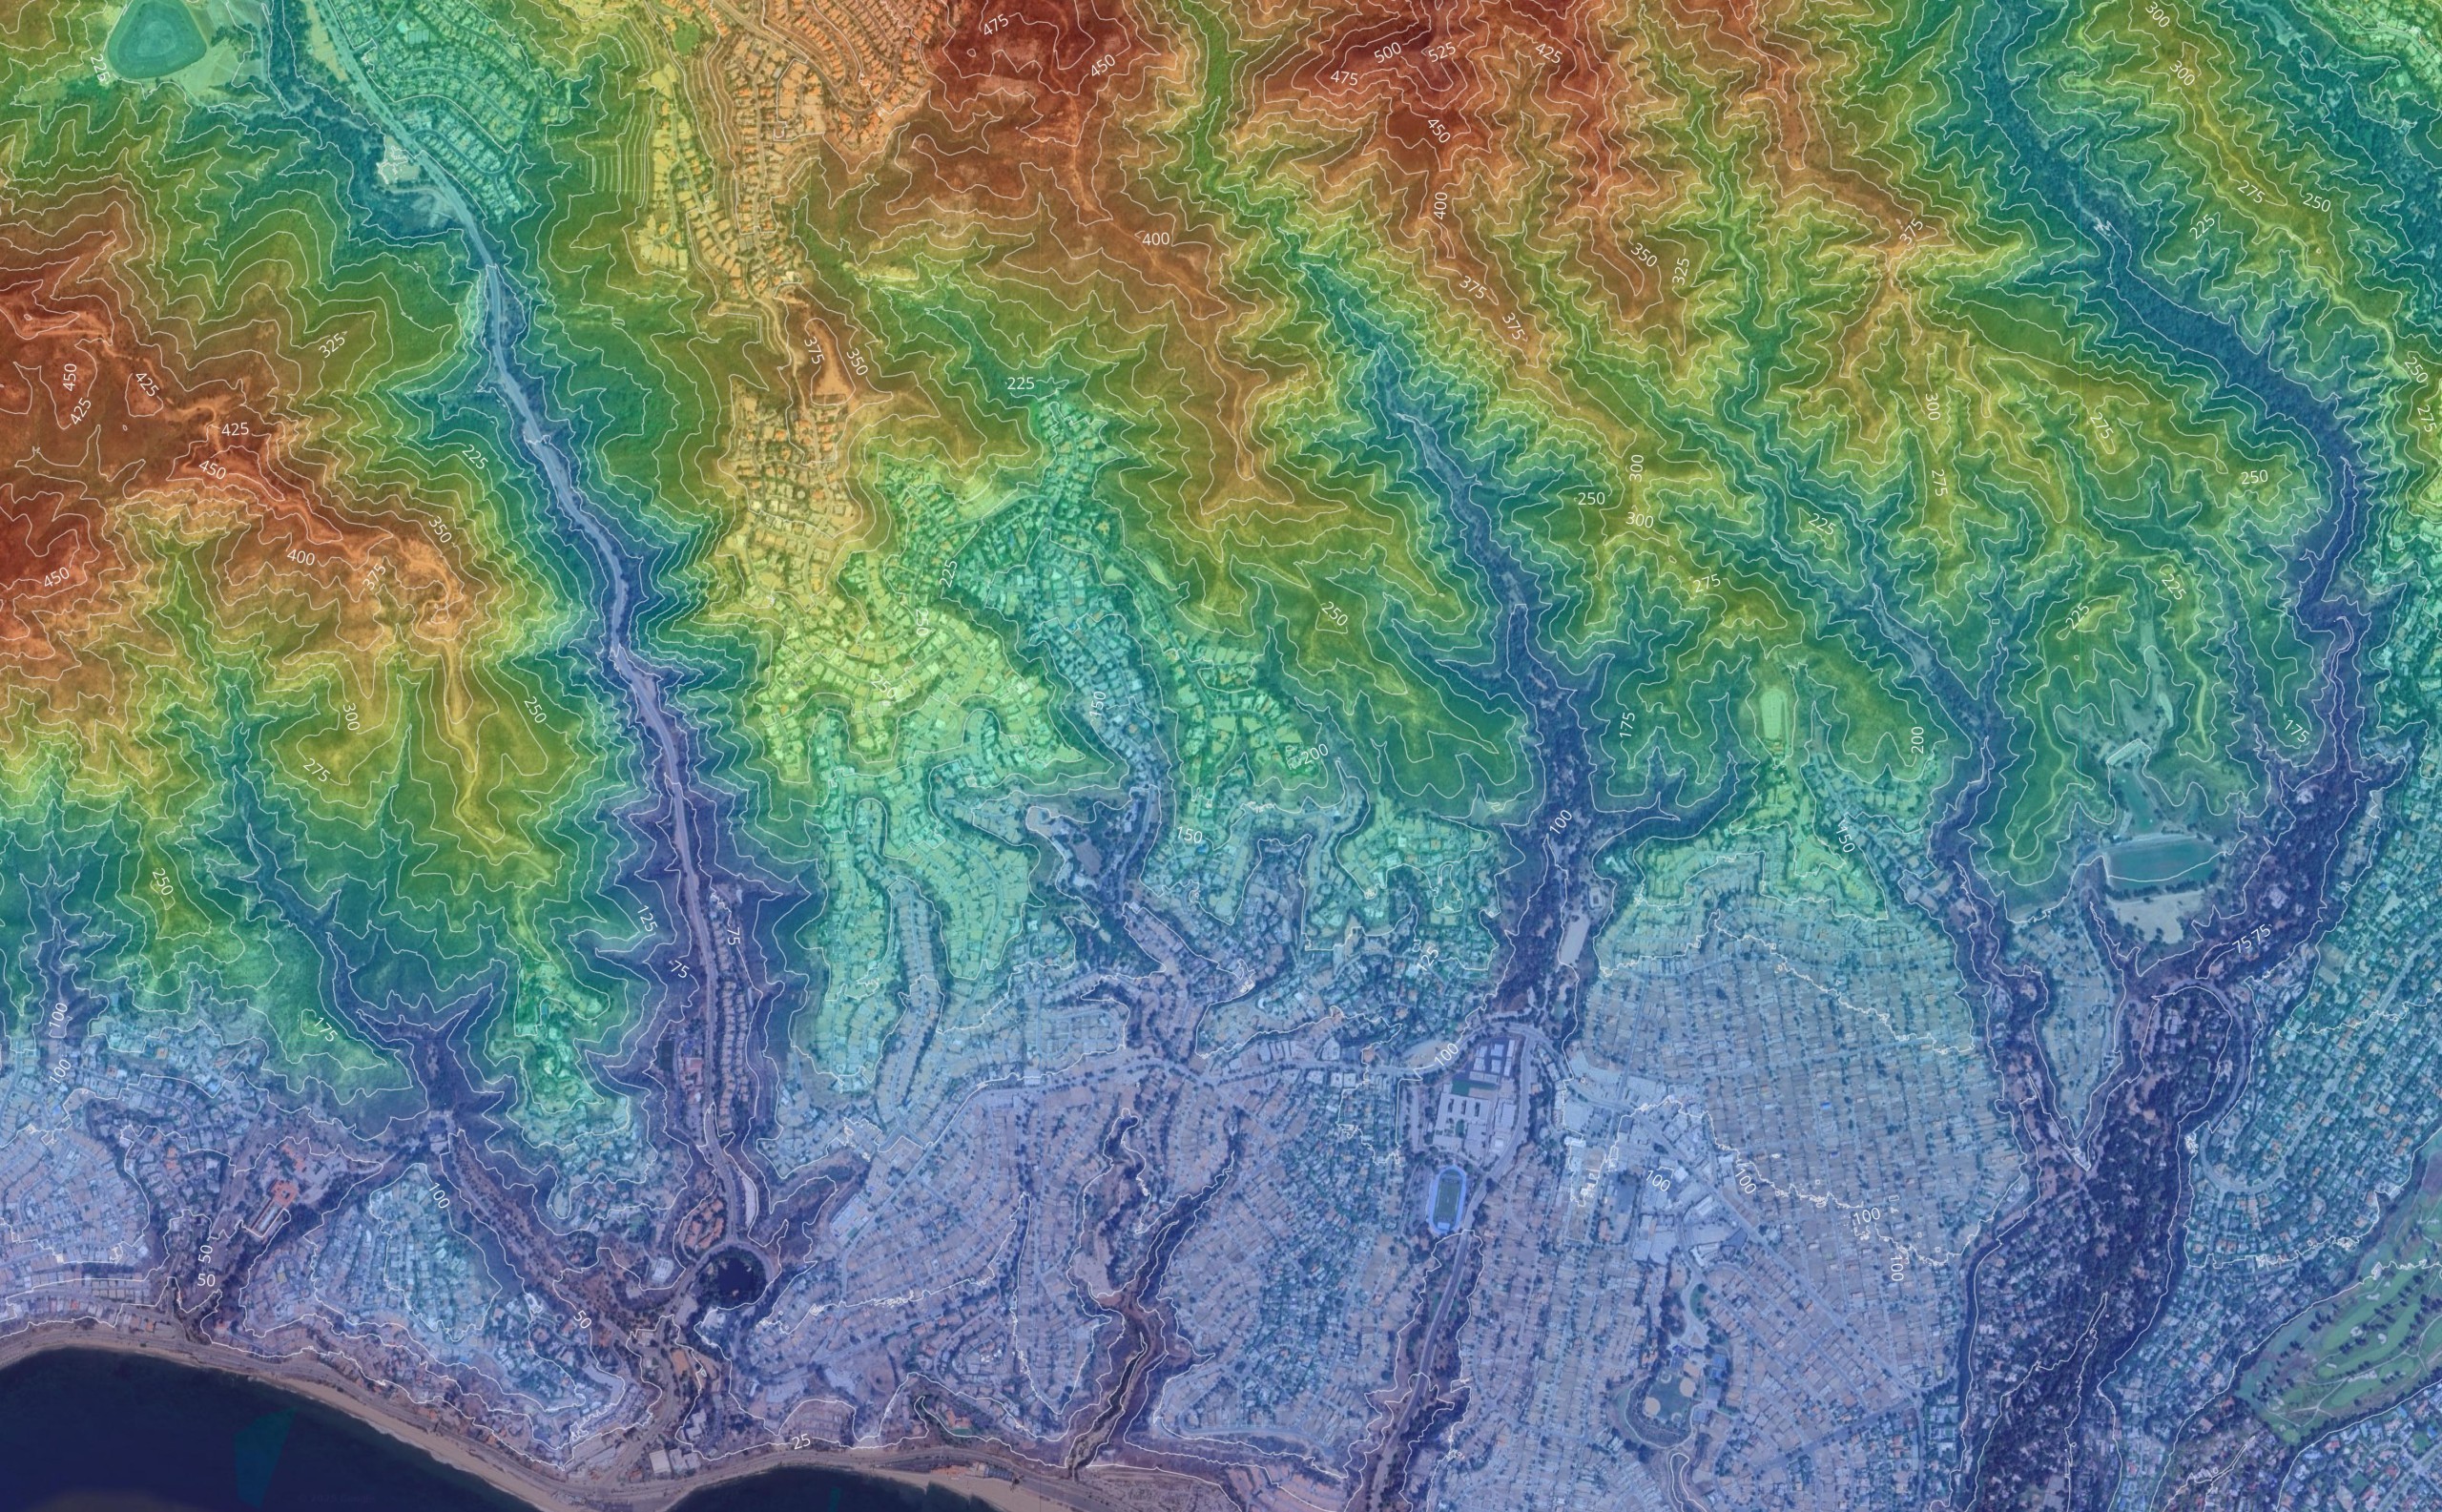
Topographic maps are the foundation of most land-based drone survey projects I run. They represent the Earth’s surface in terms of elevation, slope, and terrain shape — helping engineers, contractors, and planners visualize the real world in two dimensions. In practice, they’re used for everything from grading and drainage plans to roadway design and site development. Historically, topography mapping methods included plane table surveying, which laid the groundwork for the modern techniques we rely on today.
With drone data, we can now create highly detailed topographic maps without ever setting foot on the ground. I typically use lidar data or high-resolution photogrammetry, depending on the project’s needs. For vegetated or rough terrain, LiDAR gives me clean bare-earth returns. For urban sites or clear ground, photogrammetry can be just as effective and even more detailed visually.
From Data Collection to Deliverables
During data collection, I plan flights around factors like overlap, altitude, and GNSS signal quality. For topographic work, I often fly at around 250–300 feet AGL, using RTK or PPK corrections to achieve sub-5 cm horizontal accuracy. Depending on client needs, deliverables may include:
- Contour maps at 1-ft or 2-ft intervals
- Digital terrain models (DTMs)
- Cut and fill analysis
- Surface slope reports
These topographic deliverables are usually requested on tight timelines, which is why drone-based surveys have become the default method for fast, safe, and accurate mapping.
Integration with Bathymetric Mapping
One of the things I push for on mixed-terrain jobs is seamless integration between topographic maps and bathymetric maps. When you capture both in a single workflow — using LiDAR sensors that can handle land and shallow water — you eliminate gaps and reduce post-processing headaches. The result is a unified surface model that serves multiple disciplines: civil, environmental, and marine.
Data Collection
In both topographic and bathymetric surveys, the quality of your data collection determines everything downstream — from processing to final deliverables. Over the years, I’ve refined my drone-based workflow to adapt to a wide range of environments, from dry desert grading sites to coastal lagoons and underwater peaks.
For topographic data, I rely on airborne lidar systems that deliver tight point spacing, consistent accuracy, and the ability to punch through vegetation. On the bathymetric side, my go-to tools include airborne laser bathymetry units using green wavelengths. These allow me to collect bathymetric charts with depth readings that reflect both the ocean surface and the underwater cousin of topography — the ocean floor.
Factors That Affect Survey Success
No matter the terrain, several elements influence how reliable your data collection will be:
- Sun angle and cloud cover
- Water quality, turbidity, and clarity
- Sound waves reflecting off the surface
- Local navigational hazards or obstacles
- The presence of underwater mountains or structural complexity
For bathymetry, even minor subtle variations in water depth or bottom texture can affect the returns. That’s why I often run test flights or small calibration passes to dial in my settings before committing to a full flight path.
Why Language Matters in Mapping
It’s easy to think of topography and bathymetry as purely technical terms, but I’ve always found their origins interesting. Topography means writing — literally “writing of place” — and word bathymetry has a similar root: Greek bathy, meaning “deep,” and metron, meaning “measure.” These disciplines don’t just describe surfaces; they interpret them — through elevation lines, digital models, and layered datasets. Both topography and bathymetry visualize three-dimensional terrain on a two-dimensional medium, making complex landscapes accessible and understandable.
When you think of topography as a kind of “surface language,” and bathymetry as its underwater cousin, it’s easier to explain the value of mapping to clients who aren’t familiar with geospatial work. It’s not just about collecting data — it’s about telling the story of the landscape, from mount everest to the mariana trench.
High Resolution
In drone-based mapping, high resolution isn’t just a buzzword — it’s the difference between a rough surface model and a deliverable you can stake a construction budget on. Whether I’m building topographic maps or bathymetric charts, the goal is always the same: extract the most detail possible while balancing flight time, file size, and data clarity.
With airborne lidar, I can produce dense point clouds that clearly show contour lines, road edges, vegetation height, and even surface artifacts that would have been missed by boots-on-the-ground methods. In bathymetric surveys, the challenge is even greater — underwater returns are affected by water quality, typical depth, and even wave movement. But with the right conditions, you can still generate shaded relief models of the seafloor morphology that rival anything from a boat-based multibeam sonar.
Why High Resolution Matters in Real-World Projects
In my coastal and environmental work, clients need to see change over time — erosion, sedimentation, vegetation spread — and that requires detail. A blurry DEM doesn’t cut it. Projects like climate change modeling, shoreline retreat, and marine habitat protection rely on environmental information that’s precise and repeatable.
For example, I’ve used high-resolution bathymetric LiDAR to document shifts along the atlantic seafloor, near estuarine zones where scale alongside reference features (like bridge pilings or channel markers) is critical. I’ve also mapped coastal elevations adjacent to sites where the mid Atlantic ridge system influences sediment flow — one of the many subtle geologic drivers affecting the world’s oceans.
Understanding the Language of Mapping
I always tell clients that word topography and word bathymetry share more than etymology — they reflect different ways of seeing the planet. Topography writes the land; bathymetry writes the sea. Both come from the Greek topos (place) and graphia (writing). That’s their original sense — not just to measure, but to describe.
Whether it’s the highest peak or the deepest trench, the tools we use are extensions of how we think about space. That’s why I treat every project like a conversation between surface and structure — between what we see, and what we reveal.
Ocean Floor
Every time I map the ocean floor with drones, I’m reminded just how different it is from land-based surveying. What looks flat from the surface is often complex beneath — filled with underwater surfaces that rise and fall, shift with sediment, and hide structures you can’t detect with a visual flyover. That’s why I rely on airborne laser bathymetry — and occasionally supplement with tools like echo sounders when water clarity isn’t favorable for laser-based returns.
Unlike traditional methods that require boats, drones let us access shallow zones where small shifts in typical depth can reveal underwater hazards, channels, or infrastructure. It’s a critical part of ocean exploration — especially when supporting projects tied to marine science, coastal resilience, or habitat restoration.
The Ocean Floor: A Reversed Map
There’s something poetic about how bathymetry flips topography on its head. In a way, it’s topography flipped upside — not measuring hills and valleys above, but mapping trenches and ridges below. The patterns are strikingly similar, just viewed from the opposite direction.
Organizations like the NOAA Office and NOAA National Centers rely on high-resolution bathymetric datasets to manage maritime navigation, support research, and monitor coastal change. Their mapping standards help guide the work I do in the private sector — ensuring consistency across both government and commercial deliverables.
Closing Thoughts
After more than a decade of running drone data collection, I’ve learned that understanding the difference between topography and bathymetry isn’t just academic — it directly affects how you plan a mission, what gear you load out, and how you deliver results to your clients.
Mapping the land and mapping the ocean floor may use similar drones, but the environments couldn’t be more different. One deals with elevation, surface texture, and shaded relief. The other works through water, light distortion, and underwater features most people never even consider. Yet, when both are done right, they produce a complete picture — one that lets engineers build smarter, scientists model more accurately, and decision-makers plan with confidence.
What used to take weeks by boat or boots can now be done in a single morning with a drone, some clean weather, and the right sensor. That’s not just a shift in tools — it’s a shift in what’s possible.
If you’re mapping environments where land meets water — and you want a workflow that actually works — knowing when you’re working in topography, bathymetry, or both is the difference between a good map and a great one.